The Hundred-Year Chair · a chapter
Worth Its Footprint
Readers have been shouting one objection at me since the six-dollar chair. Never mind the economics: the monobloc is plastic, it ends in landfill, it sheds particles into the sea and the bloodstream. So the wooden chair, milled and shipped and finished, must spend less of the world than a chair squirted from a mold in seventy seconds. It may not.
Every object has a footprint. So did living in the Pleistocene: our ancestors burned whole forests, and cooked and warmed themselves on wood. (Sorry, Dad.) The question is never whether an object has a footprint. It is how big, compared to what, and whether we are measuring or vibing.
The instrument I teach comes, pleasingly, from the country of Rietveld and Eek. The Eco-indicator method was built in Amersfoort by Mark Goedkoop and his colleagues at PRE. It follows a product through production, use, and disposal, across eleven kinds of impact, grouped into damage of three sorts: to human health, to ecosystem quality, and to resources. Then it does the thing that makes it usable by a designer. It tallies everything into a single currency, the ecopoint, scaled so that a thousand points is one average European's environmental load for a year. Two kilograms of polypropylene granulate, a monobloc's worth of pellets, is 660 millipoints. About six hours of a European year.
The version I use, Eco-indicator 99, is not the newest. I keep teaching it because it is transparent enough to work through by hand. A number you derive yourself teaches more than a sharper one from a report. The same group later folded EI99 into a method called ReCiPe, which most practitioners now reach for.
Two findings from that accounting reliably shock my students. The first is that materials and disposal, the parts that feel like environmental sin, are usually a small fraction of a lifecycle's total. The second is that the big impacts hide in activities that do not feel like consuming material at all. For almost anyone reading this book, air travel dwarfs plastics. I put a flight through the Eco-indicator tables twenty years ago and have shown students the result ever since. A single round trip from New York to San Francisco comes out at about two hundred and fifty thousand styrofoam coffee cups, per person on the plane.
The classic result in the field runs against instinct in the same direction. Martin Hocking, writing in Science in 1991, found that a paper cup consumes about as much hydrocarbon as the polystyrene cup it was supposed to redeem, along with far more energy and thirty-three grams of wood the foam cup does not need.
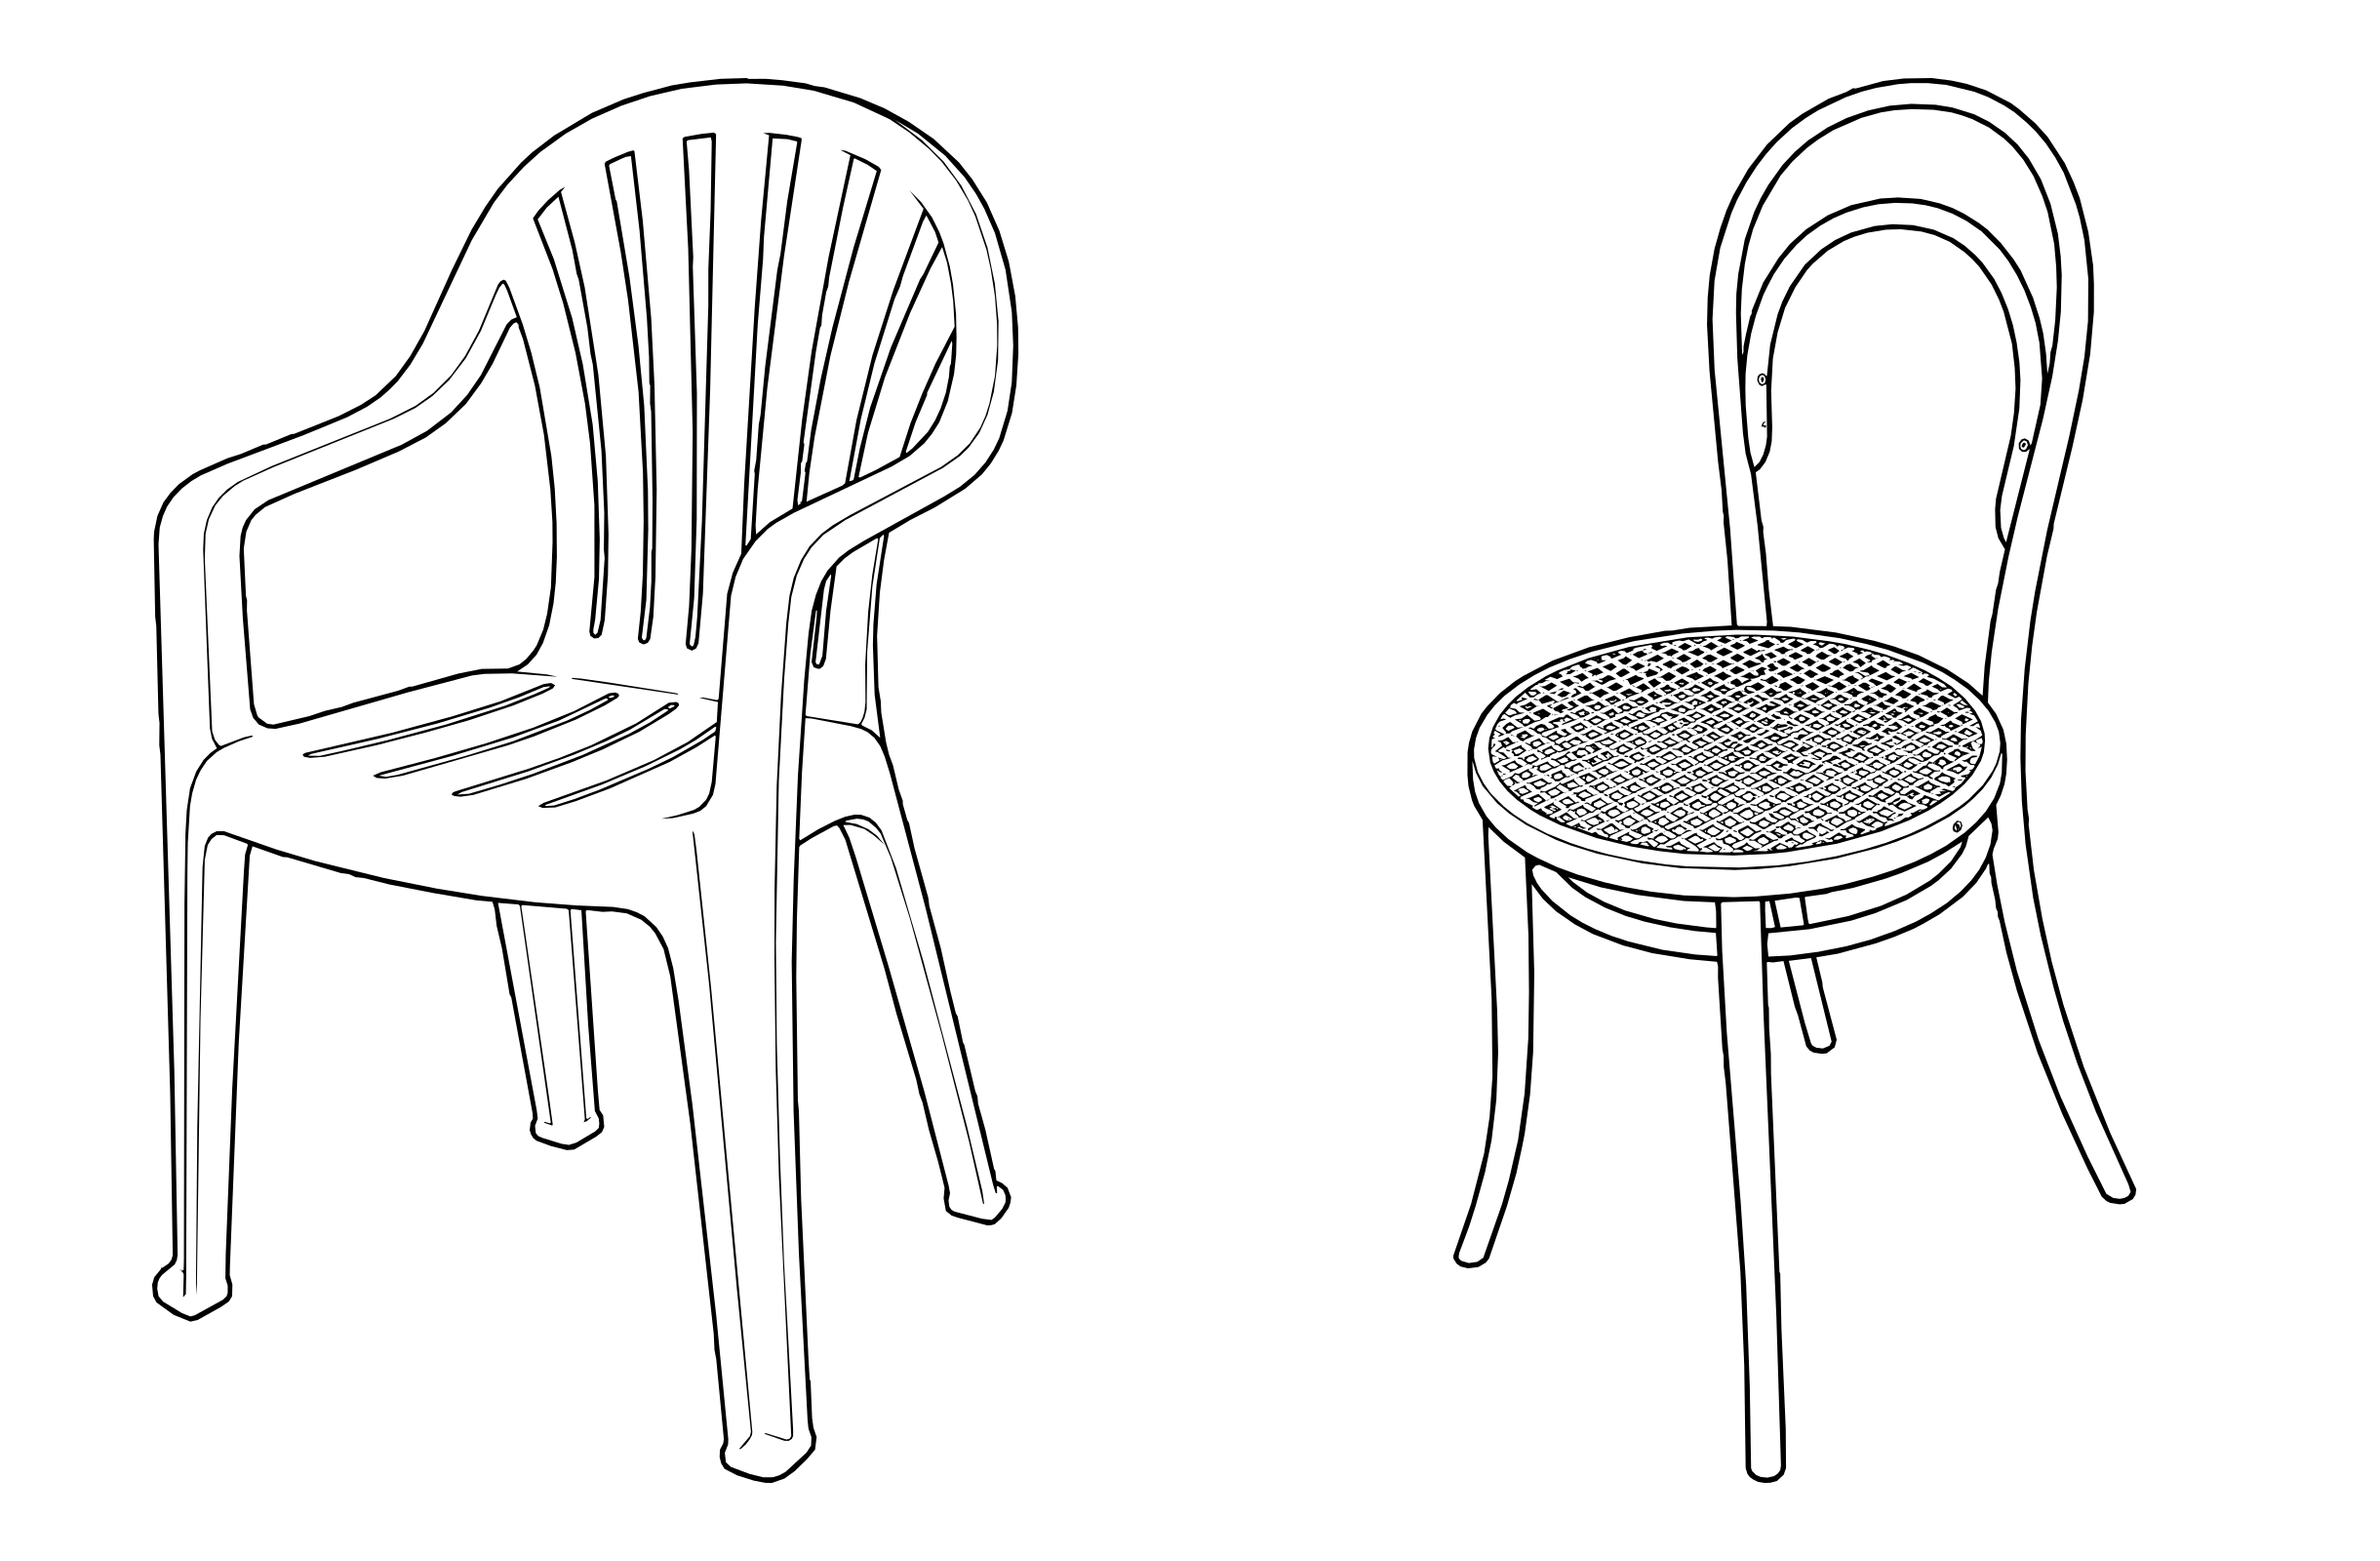
So I ran the numbers on the chair. When I first drafted this, I wrote that the monobloc might well beat the sainted bentwood Thonet No. 14 on a lifecycle basis. I would not assert it until the analysis was done. So the machine did it: a full Eco-indicator model of both chairs, cradle to grave, made in China and delivered to America, every characterization factor sourced, every uncertain parameter drawn from a stated distribution, run two hundred thousand times. It corrected itself along the way, in this project's house style. The first pass gave the bentwood a two-to-one win, until declared export volumes replaced my estimated ones and cut the margin to nothing.
Per chair, the answer is a dead heat. The reason is the monobloc's trick, the stacking that Chaironomics met as a freight cost.
| Where the footprint goes | Monobloc | Thonet No. 14 |
|---|---|---|
| Raw material | 73% | 16% |
| Manufacturing | 6% | 13% |
| Freight, factory to your door | 23% | 66% |
| Packaging and end of life | -3% | 4% |
| Total per chair | 1.65 Pt | 1.67 Pt |
| Assumed service life | 5 years | 40 years |
| Per year of service | 332 mPt | 42 mPt |
Eco-indicator 99, cradle to grave, made in China and delivered to the United States; medians of a two-hundred-thousand-run Monte Carlo model, shares rounded. The two chairs tie per object and part company per year of use. Freight is the whole story: the monobloc bare-stacks 1,852 to a shipping container against the assembled No. 14's 628, so shipping is two-thirds of the bentwood chair's footprint while the plastic is nearly three-quarters of the monobloc's. One ecopoint, a thousand millipoints, is one average European's environmental load for a year.
The method's manual insists on a caveat. I will honor it by breaking it in the open. ISO 14042 holds that a single score like this one may never be used in a comparative assertion disclosed to the public. I am disclosing one. My defense is simple. A model with every assumption on the table is not the label on a box that the rule was written to police. And the number I actually care about is still to come.
Divide by the years each chair earns and the tie shatters. At the service lives in the table the No. 14 wins by a factor of eight, with near certainty. Over any fixed thirty years it wins fivefold, even when you have to buy it twice. Those two lifetimes are assumed rather than measured. They are the model's weakest link. A skeptic should push on them first.
So the environmental case is not the one most people would guess. Per object, wood and plastic roughly tie. The verdict rides on service life and almost nothing else. A durable chair earns its ecopoints only if it is actually kept. A durable one thrown away early is only a monobloc that cost the planet more. Keeping it is the whole of what lovable, legible, and maintainable are for.
So a hundred-year chair is not a low-footprint chair but a chair worth its footprint. Every object spends ecopoints. The honest question is whether what you got was worth what the planet paid. I am willing to spend some of mine on a thing my grandchildren will sit in. I resent spending any on a thing nobody will grieve.
The whole case turns on one word, kept. What it takes to keep a thing across a century, and why most things are not kept, is the next chapter.
The ecopoint and the Eco-indicator method: Eco-indicator 99 per Goedkoop and Spriensma, PRE Consultants, Amersfoort, published by the Dutch Ministry of Housing, Spatial Planning and the Environment, with RIVM and a panel of Swiss experts acknowledged as contributors. Eleven impact categories grouped into three damage categories, human health, ecosystem quality, and resources. The definition of the point, one thousandth of the yearly environmental load of one average European, is verbatim from the Manual for Designers, section 1.7. Polypropylene granulate is 330 millipoints per kilogram in the EI99 tables, hence 660 for two kilograms; that figure covers production of the granulate only, not processing, transport, or disposal, which the tables carry separately. The successor method is ReCiPe (Goedkoop and colleagues, 2008), which is why the text calls EI99 the older method. The ISO 14042 provision against public comparative assertions from single scores is quoted in the manual itself.
The flight-versus-cups equivalence is the author's own Eco-indicator calculation, made about twenty years ago and taught in his product design course since. The result is 250,000 cups, stated in the text. The working is reconstructed from the published EI99 tables in notes/ei99-flight-vs-cups-reconstruction.md, which states the one assumption it cannot avoid: EI99 publishes no passenger-air figure, only freight in millipoints per tonne-kilometre, so a per-passenger number requires allocating a mass to a person. At the continental narrowbody row, 120 mPt per tonne-kilometre, 250,000 cups falls out at 141 kilograms allocated per passenger, which is a defensible allocation. The figure is sound to its order of magnitude and to about a factor of two; the method cannot make it sound to more, since it publishes no passenger-air value at all. Paper versus polystyrene: Martin B. Hocking, "Paper Versus Polystyrene: A Complex Choice," Science 251:4993 (February 1991), 504 to 505, with 980 against 154 kilowatt-hours per tonne of energy and 33 grams of wood the foam cup does not need.
The chair comparison was run 24 August 2026 as a Monte Carlo Eco-indicator 99 model (Hierarchist, Average weighting; 200,000 iterations; cradle to grave, China production, US delivery), archived in the project record with every factor sourced in the code and a declared revision history: pass one used estimated shipping volumes and favored the bentwood 1.9 to 1; pass two substituted declared export volumes and produced the per-chair tie. Figures quoted, before rounding: monobloc 1,653 mPt per chair [1,130 to 2,505], No. 14 1,672 [1,344 to 2,116], P(monobloc worse) 48 percent; per-service-year ratio 7.95 median, P 99.9 percent; 30-year ratio 5.5, P 99.8 percent; container counts 1,852 against 628; freight shares 23 against 66 percent; polypropylene granulate 73 percent of the monobloc score. Service lives are assumed distributions (monobloc median 5 years, No. 14 median 40) and are the analysis's declared weakest link; the US road haul is its largest single bentwood term and is an assumption. A paywalled 2026 industrial LCA of a polypropylene chair (Maggi et al., Environ. Prog. Sustain. Energy, DOI 10.1002/ep.70126) is flagged for library retrieval; nothing quoted here relies on it.
A chapter of The Hundred-Year Chair, drafted and refined in public. The same text lives in the book; the interactive tools and the fully-sourced technical notes live here. home · the book · the technical notes · hundredyearchair.com